Is your XRP portfolio feeling the chill? If you’re an XRP holder, you’ve likely noticed the persistent downward pressure on its price. Over the past few months, XRP, the digital asset powering the XRP Ledger and closely associated with Ripple, has been on a bumpy ride. Let’s dive into why XRP is struggling and what the charts are telling us.
Why is XRP’s Price Under Pressure?
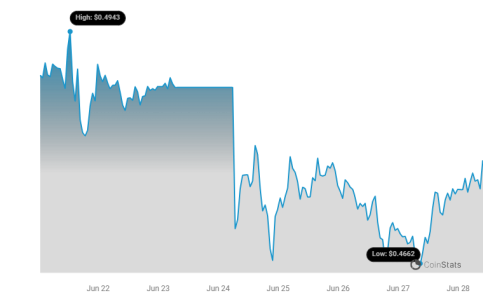
XRP has experienced a significant dip, losing 11.6% in the last 30 days and a substantial 24% over the past six months. Even in just the last week, it’s shed another 4%. Currently hovering around $0.47, the struggle to reclaim the $0.50 mark is real. What’s behind this persistent downturn?
- The Lingering SEC Lawsuit: The elephant in the room remains the ongoing legal battle between Ripple and the Securities and Exchange Commission (SEC). This lawsuit casts a long shadow of uncertainty over XRP. Investors are hesitant, and this legal overhang significantly dampens enthusiasm for any potential price surges.
- Broader Bearish Market Sentiment: It’s not just XRP. The entire cryptocurrency market has been experiencing headwinds. Recently, Bitcoin, the crypto king, dipped to a low of $58,000 before showing signs of recovery, currently trading around $61,500. This overall market downturn naturally impacts altcoins like XRP.
- Investor Capitulation: On-chain data from Santiment reveals that XRP investors are realizing losses as the price dips below $0.50. This suggests a phase of capitulation, where holders are selling off their assets, potentially fearing further declines. Interestingly, reports also indicate that XRP, alongside ADA, is currently a target for short-sellers, adding further downward pressure.
XRP Price Analysis: Decoding the Charts
Let’s move beyond the headlines and delve into what the technical charts are indicating for XRP. What can price analysis tell us about potential future movements?
Simple Moving Averages (SMAs): Bearish Signals
Analyzing XRP’s yearly price chart reveals a bearish picture based on Simple Moving Averages (SMAs):
- Below 50 and 200 SMAs: XRP’s price is currently trading below both its 50-day and 200-day SMAs. This is generally considered a bearish signal, indicating negative momentum in both the short-term and long-term perspectives.
- SMA Levels: The 50 SMA is currently around $0.524, and the 200 SMA sits at $0.543. These levels now act as resistance, meaning XRP needs to break above these points to signal a potential trend reversal.
Relative Strength Index (RSI): Approaching Oversold?
The Relative Strength Index (RSI) is a momentum indicator that helps identify overbought or oversold conditions. For XRP:
- RSI Value: Currently, XRP’s RSI is around 38 and trending downwards.
- Oversold Territory: An RSI below 30 is typically considered oversold. XRP is approaching this level, suggesting that the asset may be nearing a point where it’s undervalued and could potentially see a price bounce. However, it’s crucial to remember that RSI can remain in oversold territory for extended periods during strong downtrends.

Moving Average Convergence Divergence (MACD): Weakening Bearish Momentum
The Moving Average Convergence Divergence (MACD) is another momentum indicator that can provide insights into trend direction and strength:
- Bearish MACD Crossover: XRP’s MACD line is below the signal line. This indicates bearish momentum, confirming the overall downtrend.
- Histogram Approaching Zero: While the MACD histogram is still negative (confirming bearish momentum), it’s moving closer to zero. This suggests that the strength of the bearish momentum may be weakening, potentially hinting at a possible stabilization or even a reversal in the future.
Key Support and Resistance Levels for XRP
Identifying key support and resistance levels is crucial for understanding potential price movements:
- Resistance: XRP faces immediate resistance around its moving averages (50 and 200 SMAs) and the psychological $0.50 level. Breaking above these levels is crucial for any bullish recovery.
- Support: On the downside, XRP has support around $0.465 and further down at $0.40, a level where it recently found support after hitting a low. These levels could act as cushions to prevent further price drops, at least in the short term.
Can XRP Recover?
The question on every XRP holder’s mind is: can XRP bounce back? While technical indicators offer clues and support/resistance levels provide boundaries, the future price action of XRP is heavily influenced by external factors, primarily the outcome of the SEC lawsuit and the overall cryptocurrency market sentiment. A positive resolution in the Ripple case could be a major catalyst for a significant price surge. Conversely, continued legal uncertainty and a prolonged bear market could keep XRP under pressure.
Keep in mind: The cryptocurrency market is known for its volatility. While technical analysis and market news can provide valuable insights, they are not guarantees of future price movements. Always conduct thorough research and consider your risk tolerance before making any investment decisions.
Disclaimer: The information provided is not trading advice. Bitcoinworld.co.in holds no liability for any investments made based on the information provided on this page. We strongly recommend independent research and/or consultation with a qualified professional before making any investment decisions.
Disclaimer: The information provided is not trading advice, Bitcoinworld.co.in holds no liability for any investments made based on the information provided on this page. We strongly recommend independent research and/or consultation with a qualified professional before making any investment decisions.


