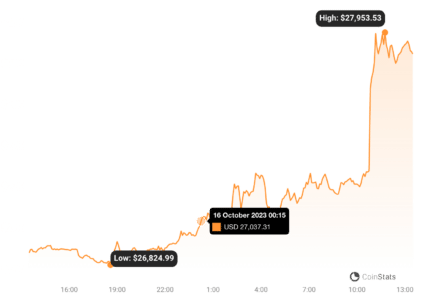
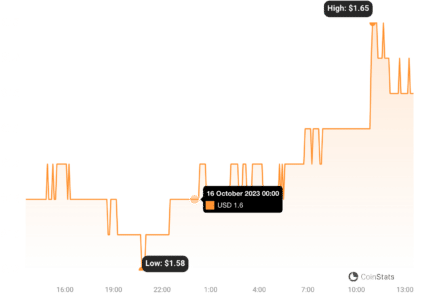
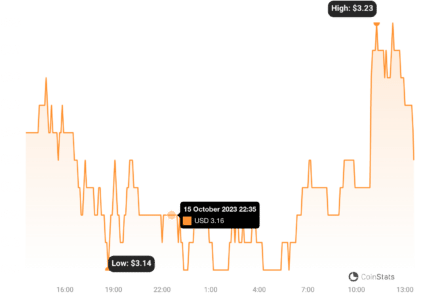
Navigating the crypto seas can feel like charting a course through unpredictable waters, right? One minute you’re riding high on a green wave, the next you’re bracing for a sudden dip. Bitcoin, the granddaddy of crypto, is currently holding its ground above the $26,500 mark. This stability is making traders everywhere pause and ask: Is it time to re-evaluate our positions on altcoins like SOL, LDO, ICP, and VET? Let’s dive into a detailed price analysis to understand what might be brewing in the crypto market.
Bitcoin’s Balancing Act: Bullish or Bearish?
The traditional markets are sending mixed signals. The S&P 500 saw a slight 0.45% increase, marking its second positive week. Gold, often seen as a safe haven, is shining brightly with a 5% surge this week. Bitcoin even had a stellar day on October 13th, jumping 3.11% – its best single-day performance since December! But, the week seems to be closing with a bit of a pullback, down over 3%. Confusing, right?
The crypto chatter points to Bitcoin’s recent wobble and ongoing regulatory uncertainties as reasons why investors are hesitant to jump into altcoins. Bitcoin’s dominance in the market is holding steady around 50%, suggesting altcoins are waiting for a clearer signal. So, what should we watch for with Bitcoin?
Analysts are glued to Bitcoin’s charts. The key question is: Can Bitcoin bulls keep the price above $25,000? If they can, it could signal a broader bullish move for the entire crypto market. A strong Bitcoin often lifts the spirits (and investments!) across the crypto board.
Keep an eye on these critical Bitcoin price points:
- $27,110: The 20-day EMA. Breaking above this could signal a push towards $28,143.
- $26,671: The 50-day SMA. Falling below this might trigger a drop to $25,990, and potentially further to $24,800.
Let’s break down the technical analysis:
Bitcoin Price Analysis – What Charts are Telling Us?
Bitcoin’s price action has been like a tightly coiled spring, oscillating around its moving averages. This usually means a big move is coming – but which way will it spring?
Potential Bullish Scenario:
- If buyers can push the price above the 20-day EMA ($27,110), we might see a rally towards $28,143.
- Expect some resistance around $28,143 from the bears.

https://coinstats.app/coins/bitcoin/
Potential Bearish Scenario:
- If the price dips below the 50-day SMA ($26,671), bears might take control.
- This could lead to a drop to $25,990, followed by a crucial support level at $24,800, where buyers might step in.
Short-Term View (4-Hour Chart):
- Bitcoin is facing resistance at the 20-EMA on the 4-hour chart.
- Bulls are showing resilience, holding their ground.
- Bullish Break: If the price breaks above the 20-EMA, targets are $27,750 and $28,143.
- Bearish Break: Failing to break the 20-EMA could lead to a drop towards $26,000 and $24,800.
Solana (SOL) Price Check: Ready to Break Out?
Solana is currently in a tug-of-war between bulls and bears around the 20-day EMA ($21.77). Bulls are trying hard to establish this level as support. Can they succeed?

https://coinstats.app/coins/solana/
Bullish Outlook for SOL:
- A minor hurdle at $22.50 needs to be cleared.
- Breaking above $22.50 could propel SOL towards the neckline of an inverse head and shoulders pattern.
- A solid break above this neckline would confirm the bullish pattern, with potential targets at $27.12 and even $32.81.
Bearish Outlook for SOL:
- If the price falls below the 50-day SMA ($20.50), it could trigger a deeper correction.
- Potential downside targets are $18.58 and $15.33.
Short-Term View (4-Hour Chart):
- SOL broke below the 20-EMA on the 4-hour chart, suggesting bearish pressure.
- Immediate support around $20.93 and $20.
- Bullish Reversal: Holding above the 20-EMA indicates buying interest. A break above the 50-SMA could trigger a rally to $23.50 and the inverse H&S neckline.
Lido DAO (LDO) Price Analysis: Bulls Gaining Ground?
Lido DAO has been trading sideways around its moving averages, but there are hints that bears might be losing their grip. Moving averages are flattening, and the RSI is turning positive. Is LDO ready for a bullish comeback?

https://coinstats.app/coins/lido-dao/
Potential Upside for LDO:
- Immediate resistance at $1.73.
- Breaking above $1.73 could lead to a move towards the downtrend line. Expect strong resistance there.
Potential Downside for LDO:
- Falling below moving averages would signal a return of bearish control.
- Potential retest of support at $1.38.
Short-Term View (4-Hour Chart):
- 20-EMA is turning upwards, and RSI is positive on the 4-hour chart – bullish signs.
- Minor resistance at $1.63 likely to be overcome.
- Target: $1.73.
- Bearish Scenario: Bears need to quickly push the price below moving averages to trigger a drop to the $1.45-$1.50 support zone.
Internet Computer (ICP) Price Check: Ready to Break the Range?
Internet Computer has been stuck in a range between $2.86 and $3.35 for a while now. However, a positive divergence on the RSI suggests selling pressure might be easing. Could ICP finally break out?

https://coinstats.app/coins/internet-computer/
Bullish Breakout Potential for ICP:
- Targeting the overhead resistance at $3.35.
- Breaking and closing above $3.35 would signal a potential trend change.
- Upside targets: $4 and $4.50.
Range-Bound Scenario for ICP:
- Rejection at $3.35 could mean ICP stays within the $2.86-$3.35 range for longer.
- Falling below $2.86 would resume the downtrend.
Short-Term View (4-Hour Chart):
- Bullish crossover of moving averages and overbought RSI on the 4-hour chart – buyers in control.
- Likely to test resistance at $3.35. Expect strong selling pressure there.
- Consolidation or Breakout? Rejection at $3.35 could lead to continued consolidation. Breaking above $3.35 could propel ICP to $3.74 and the pattern target of $3.84.
VeChain (VET) Price Appraisal: Triangle Tightening – Which Way Will it Break?
VeChain has been trading within a descending triangle pattern, typically a bearish formation. However, the price is showing resilience near the downtrend line. Moving averages are flattening, and the RSI is near the midpoint. Are buyers planning a surprise breakout?

https://coinstats.app/coins/vechain/
Potential Bullish Invalidation for VET:
- Buyers are trying to break above the descending triangle’s downtrend line.
- Success would invalidate the bearish pattern and could trigger a rally towards $0.021.
Potential Bearish Continuation for VET:
- Rejection at the downtrend line would confirm bearish resistance.
- Potential retest of support at $0.014.
Short-Term View (4-Hour Chart):
- VET is in a falling wedge pattern on the 4-hour chart.
- Buyers are trying to push above the 50-SMA.
- Breaking above the wedge downtrend line could spark a new uptrend.
- Resistance Zone: Bears are likely to defend the area between the 50-SMA and the wedge downtrend line.
- Bearish Signal: A sharp downturn below the 20-EMA could mean VET remains within the wedge for longer.
Final Thoughts: Crypto Market Dynamics in Play
The cryptocurrency market is a whirlwind of activity! This analysis highlights the intricate dance between bulls and bears for Bitcoin, Solana, Lido DAO, Internet Computer, and VeChain. Each cryptocurrency presents its unique market dynamics, creating a vibrant and constantly evolving landscape. Whether you’re a seasoned trader or just starting your crypto journey, understanding these price movements is crucial for navigating this exciting market. Keep watching those charts, stay informed, and happy trading!
Disclaimer: The information provided is not trading advice, Bitcoinworld.co.in holds no liability for any investments made based on the information provided on this page. We strongly recommend independent research and/or consultation with a qualified professional before making any investment decisions.


