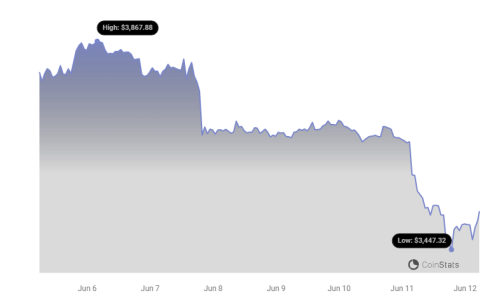
Ethereum (ETH), the second-largest cryptocurrency by market cap, is once again facing downward pressure after a brief attempt to rally. Just when investors hoped for a breakout above the $3,720 resistance, ETH’s price action took a bearish turn. Are we looking at a temporary setback, or is this the beginning of a more pronounced downtrend for Ethereum? Let’s dive into the factors influencing ETH’s current price movement and what traders should watch out for.
Ethereum Price Retreats from Resistance
After showing promise by attempting to surpass the $3,650 resistance mark, Ethereum even briefly touched above $3,700. However, this upward momentum was quickly countered by strong selling pressure. Bears stepped in aggressively around the $3,710 peak, initiating a fresh wave of declines. This resulted in a sharp drop below the $3,660 and $3,650 levels, pushing ETH back into a consolidation phase, mirroring Bitcoin’s recent price action.
Currently, Ethereum is trading below $3,650 and crucially, under the 100-hourly Simple Moving Average (SMA). This technical indicator often serves as a dynamic resistance or support level, and its breach to the downside suggests increasing bearish momentum in the short term.
- Failed Breakout: Ethereum couldn’t sustain gains above the $3,720 resistance, signaling strong overhead selling pressure.
- Below Key Averages: Trading below $3,650 and the 100-hourly SMA indicates a shift in momentum towards sellers.
- Bearish Trend Line Forming: A key bearish trend line is emerging on the hourly chart, adding to the resistance around $3,680.
- Risk of Further Decline: A close below the $3,550 support level could trigger a more significant sell-off.
Key Resistance and Support Levels to Watch
For Ethereum to regain its bullish stance, overcoming immediate resistance levels is crucial. Conversely, failing to hold support could lead to further price depreciation.
If Ethereum attempts a recovery, the first hurdle lies near the 23.6% Fibonacci retracement level of the recent decline from $3,710 to $3,565. This level coincides with the $3,640 price point, acting as an initial resistance zone. Furthermore, the key bearish trend line, positioned around $3,680 on the hourly ETH/USD chart, presents a more significant challenge. This trend line is also reinforced by the 61.8% Fibonacci retracement level of the same downward move, making it a critical area for bulls to conquer.

A successful break above the $3,680 resistance could signal renewed bullish interest, potentially propelling Ethereum towards the $3,720 level. Beyond this, $3,750 and then $3,800 emerge as subsequent resistance targets. A strong push past $3,800 could even pave the way for a test of the $3,880 resistance zone.
On the downside, if Ethereum fails to overcome the $3,650 resistance, the path of least resistance likely remains downward. Initial support is found near $3,550, with the next significant support zone around $3,520. However, the critical support level lies at $3,500. A decisive break below this $3,500 mark could open the floodgates for a sharper decline, potentially targeting $3,320 and even $3,250 in the short term.
Could Ethereum Price Fall Further?
The possibility of further losses for Ethereum hinges on its ability to hold crucial support levels and overcome immediate resistance. Failure to sustain above $3,650 could indeed trigger a more pronounced downward movement. Let’s summarize the critical levels:
| Level Type | Price | Significance |
|---|---|---|
| Immediate Resistance | $3,640 – $3,680 | Fibonacci retracement levels, Bearish Trendline |
| Key Resistance | $3,720 | Previous resistance level |
| Major Resistance | $3,750 – $3,880 | Further upside targets |
| Immediate Support | $3,550 | Initial support level |
| Key Support | $3,500 | Critical level, break below could trigger sharp decline |
| Downside Targets | $3,320 – $3,250 | Potential targets in case of further selling pressure |
Technical Indicators Point to Bearish Momentum
Analyzing technical indicators further reinforces the current bearish outlook for Ethereum:
- Hourly MACD: The Moving Average Convergence Divergence (MACD) indicator is currently gaining bearish momentum on the hourly chart. This suggests that selling pressure is increasing.
- Hourly RSI: The Relative Strength Index (RSI) for ETH/USD is now below the 50 zone. An RSI below 50 typically indicates that bearish momentum is dominant in the market.
Key Levels to Watch:
- Major Support Level: $3,550
- Major Resistance Level: $3,650
Disclaimer: The information provided is not trading advice. Bitcoinworld.co.in holds no liability for any investments made based on the information provided on this page. We strongly recommend independent research and/or consultation with a qualified professional before making any investment decisions.
Disclaimer: The information provided is not trading advice, Bitcoinworld.co.in holds no liability for any investments made based on the information provided on this page. We strongly recommend independent research and/or consultation with a qualified professional before making any investment decisions.


