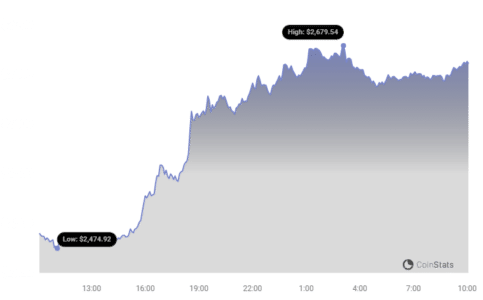
Exciting times for Ethereum enthusiasts! The second-largest cryptocurrency by market cap, Ethereum (ETH), is making waves again. If you’ve been watching the crypto markets, you’ve likely noticed ETH’s impressive climb. Just how impressive? Well, the price has surged by over 5% recently, pushing towards the $2,700 mark. But is this just a temporary spike, or is there more fuel in the tank for ETH to reach even higher targets like $2,800 or even the coveted $3,000?

Ethereum’s Fresh Price Rally: What’s Driving It?
Ethereum’s recent price action is definitely catching attention. After maintaining a stable position above the $2,420 resistance level, ETH has ignited a new surge, breaking past the $2,500 resistance point. Interestingly, this rally seems to be outperforming Bitcoin, indicating strong independent momentum for Ethereum.
Let’s break down what the charts are telling us:
- Bullish Flag Breakout: On the hourly chart for ETH/USD, a bullish flag pattern was broken at the $2,500 resistance. This technical pattern often signals the continuation of an upward trend.
- Significant Gains: The ETH/USD pair has gained over 5%, demonstrating strong buying pressure in the market.
- Breaching Key Resistance: The price decisively moved above the $2,600 resistance level, indicating a shift in market sentiment.
- Approaching $2,700: ETH even tested the $2,700 level, reaching a high near $2,681 before entering a phase of consolidation.
Currently, Ethereum is consolidating these gains, trading above the 23.6% Fibonacci retracement level from its recent swing low of $2,472 to the $2,681 high. It’s also comfortably positioned above $2,620 and the 100-hourly Simple Moving Average, further reinforcing the bullish outlook.
See Also: Franklin Templeton Has Applied For A Spot Ethereum ETF With The US SEC
Can Ethereum Reach $2,800 and Beyond?
The question on everyone’s mind is: how high can Ethereum go? If the current bullish momentum continues, analysts suggest these potential upside targets:
- Immediate Resistance: The first major hurdle is around the $2,680 level. Overcoming this could signal further upward movement.
- Next Target: $2,720: Beyond $2,680, the $2,720 level presents the next resistance.
- Eyes on $2,800: Breaking above $2,720 could pave the way for a test of the $2,800 resistance.
- The $3,000 Dream: If bulls maintain control, a push towards the psychological $3,000 level becomes increasingly possible.
For ETH to reach these ambitious targets, sustained buying pressure is crucial. Market participants will be closely watching for continued positive sentiment and trading volume.
What if ETH Price Dips? Key Support Levels to Watch
While the outlook is optimistic, it’s essential to consider potential downside scenarios. No market moves in a straight line, and corrections are a natural part of price action. If Ethereum fails to break through the $2,680 resistance, we could see a temporary pullback. Here are critical support levels to monitor:
- Initial Support: $2,630: The first level of support lies near $2,630.
- Key Support Zone: $2,600: The $2,600 zone is a more significant support area. A break below this level could indicate a deeper correction.
- Fibonacci Retracement Level: $2,575: The $2,575 mark aligns with the 50% Fibonacci retracement of the recent rally, providing another potential support level.
- 100-hour SMA: $2,520: The 100-hourly Simple Moving Average, around $2,520, acts as a robust support level.
- Major Support: $2,400: In a more significant downturn, the $2,400 level represents a major support zone.
Monitoring these support levels is crucial for understanding potential downside risks and managing trading strategies.
Technical Indicators at a Glance
Let’s quickly review what technical indicators are suggesting:
- Hourly MACD: The MACD (Moving Average Convergence Divergence) for ETH/USD is showing weakening momentum within the bullish zone. This suggests the upward momentum might be slowing down slightly, and consolidation or a minor pullback could be expected.
- Hourly RSI: The RSI (Relative Strength Index) for ETH/USD is currently above the 50 level. An RSI above 50 generally indicates bullish momentum, although it’s not in overbought territory yet, suggesting there might be room for further gains before becoming overextended.
| Indicator | Value |
|---|---|
| Major Support Level | $2,630 |
| Major Resistance Level | $2,680 |
Disclaimer: The information provided is not trading nor financial advice. Bitcoinworld.co.in holds no liability for any trading or investments made based on the information provided on this page. We strongly recommend independent research and/or consultation with a qualified professional before making any trading or investment decisions.
#Binance #WRITE2EARN
Disclaimer: The information provided is not trading advice, Bitcoinworld.co.in holds no liability for any investments made based on the information provided on this page. We strongly recommend independent research and/or consultation with a qualified professional before making any investment decisions.


