Cryptocurrency enthusiasts are keeping a close eye on market movements, and Kaspa (KAS) has certainly caught some attention recently. Bucking the trend of the past week, Kaspa’s price has shown a significant upward swing in the last 24 hours. Let’s dive into the numbers and understand what’s driving this momentum for KAS.
Kaspa’s Price Action: A Detailed Look
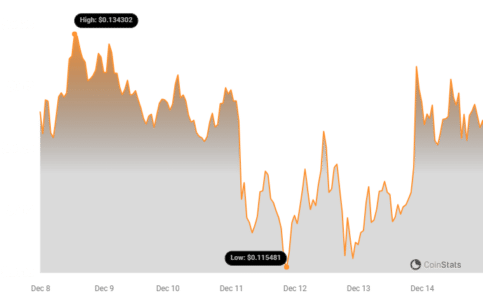
Currently, Kaspa is trading at approximately $0.13. This reflects a notable 5.48% increase over the past 24 hours. While this daily surge is impressive, it’s important to contextualize it within the broader weekly performance. Interestingly, over the last seven days, Kaspa’s price has remained relatively stable, hovering around the same $0.13 mark. It essentially held steady from the previous week to its current level.
To get a sense of Kaspa’s potential, it’s worth noting that its all-time high (ATH) stands at $0.15. This means KAS is currently trading just below its peak value, suggesting there might be room for further growth if it can breach this resistance level.

Decoding Kaspa’s Volatility: Daily vs. Weekly
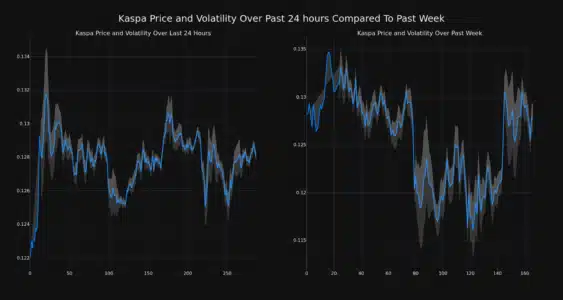
Volatility is a crucial factor for crypto traders. It essentially measures how much the price of an asset fluctuates over time. To understand Kaspa’s volatility, let’s examine the provided charts which compare the daily and weekly price movements.
The following chart visually represents Kaspa’s price movement and volatility over the last 24 hours (left) and the past week (right).

You’ll notice gray bands in these charts – these are Bollinger Bands. Bollinger Bands are a popular technical analysis tool used to measure volatility. Think of them as dynamic price envelopes.
Here’s a simplified breakdown of Bollinger Bands:
- They consist of a middle band (usually a simple moving average) and two outer bands (calculated based on standard deviation).
- Wider Bands = Higher Volatility: When the bands widen, it indicates increased price fluctuation and therefore, higher volatility. Conversely, narrower bands suggest lower volatility.
- Gray Area & Volatility: The larger the gray area between the bands at any given point, the greater the volatility at that time.
By observing the Bollinger Bands in the charts, you can visually assess and compare Kaspa’s daily and weekly volatility. This helps traders understand the risk and potential price swings associated with KAS in different timeframes.
See Also: The Price Of Immutable Increased More Than 9% Within 24 hours
Trading Volume and Circulating Supply: Fueling the Price Movement?
Another critical aspect to consider is trading volume and circulating supply. These factors can often provide insights into the sustainability and drivers of price movements.
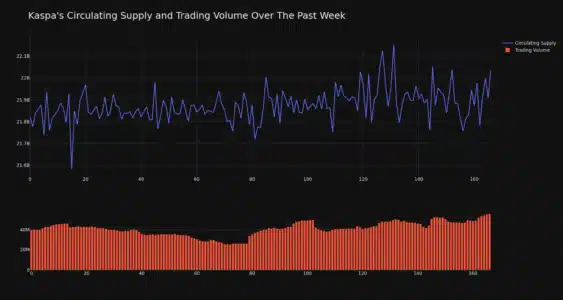
Over the past week, Kaspa’s trading volume has surged by an impressive 40.0%. This significant increase in trading activity suggests heightened interest and participation in the KAS market. Interestingly, this volume increase is happening alongside a directional movement in the coin’s circulating supply.
The circulating supply of Kaspa has also increased by 0.99% in the last week.

Understanding Circulating Supply:
- Circulating Supply: This refers to the total number of coins that are currently available to the public and in circulation in the market.
- Max Supply: This is the maximum total number of coins that will ever exist for a particular cryptocurrency.
Currently, Kaspa’s circulating supply stands at 21.92 billion KAS coins. This represents approximately 76.37% of its maximum supply of 28.70 billion KAS. As more coins enter circulation, it can sometimes influence price dynamics, especially when coupled with increased trading volume.
Kaspa’s Market Position: Ranking and Market Cap
To gauge Kaspa’s overall standing in the crypto market, let’s look at its market capitalization and ranking.
According to the latest data, Kaspa currently holds the #30 rank in terms of market capitalization. Its market cap is estimated at $2.81 billion. A market cap of this size places Kaspa among the significant players in the cryptocurrency space, indicating substantial investor interest and market value.
In Conclusion: Kaspa’s Recent Price Surge – A Sign of Things to Come?
Kaspa’s 5% price jump in the last 24 hours is a noteworthy event, especially considering its stable performance over the preceding week. The increase in trading volume and circulating supply suggests growing market activity around KAS. While it’s still trading slightly below its all-time high, the recent momentum could indicate renewed interest and potential for further price appreciation.
However, the cryptocurrency market is inherently volatile. It’s crucial to conduct thorough research and consider various factors before making any investment decisions. Keep an eye on Kaspa’s price movements, volatility, and market dynamics to stay informed about its future trajectory.
Disclaimer: The information provided is not trading advice. Bitcoinworld.co.in holds no liability for any investments made based on the information provided on this page. We strongly recommend independent research and/or consultation with a qualified professional before making any investment decisions.
Disclaimer: The information provided is not trading advice, Bitcoinworld.co.in holds no liability for any investments made based on the information provided on this page. We strongly recommend independent research and/or consultation with a qualified professional before making any investment decisions.


