Buckle up, crypto enthusiasts! Despite the recent dip in Bitcoin’s price, a prominent technical indicator is flashing a signal that could send the flagship cryptocurrency soaring to a staggering $100,000. Yes, you read that right! Even as Bitcoin navigates a bearish phase, dropping from a peak of $72,000 to around $63,500, analysts are spotting patterns that hint at a significant bullish reversal. Let’s dive into the details and see what’s fueling this optimistic outlook.
Decoding the Cup and Handle: Bitcoin’s Potential Rocket Fuel?
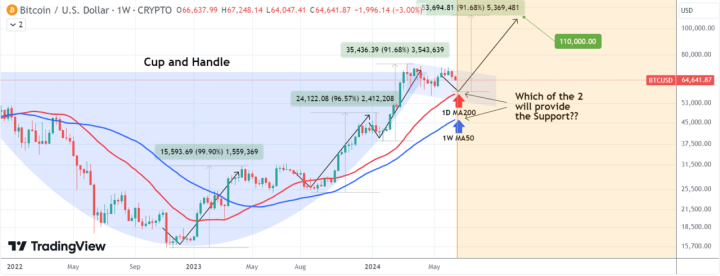
The buzz is all about the “cup and handle” pattern. Imagine a teacup – that’s essentially what we’re talking about on Bitcoin’s weekly price chart. According to a technical analysis expert, TradingShot, on TradingView, Bitcoin’s price trajectory has carved out this classic bullish formation. But what exactly is a cup and handle, and why is it generating excitement?
- The ‘Cup’ Formation: Think of it as a U-shaped recovery. The price initially trends downwards, bottoms out, and then climbs back up to roughly the starting point. This forms the rounded “cup” shape.
- The ‘Handle’ Formation: After the cup, there’s a short, slight dip – the “handle.” This handle is a minor downward drift after the cup’s rim is reached, acting as a consolidation phase before the potential breakout.
Traders widely recognize the cup and handle as a bullish signal, suggesting a potential upward price surge once the pattern completes. It essentially indicates a period of consolidation before a renewed uptrend.

Why Might This Bullish Signal Be Overlooked?
TradingShot points out that this significant pattern might be flying under the radar for some traders. In their words, it might “have gone ignored by some as traders tend to focus either on shorter term price action or cyclical structures that are often repeated from Cycle to Cycle.” Essentially, in the fast-paced world of crypto trading, sometimes the bigger picture patterns can be missed in favor of short-term fluctuations or well-trodden cyclical analyses.
Handle Formation in Progress: What to Watch For?
Currently, Bitcoin’s price chart is believed to be in the process of forming the handle of this cup and handle pattern. The recent price correction from around $65,000 to $63,500 is considered part of this handle formation. The big question is: how long will this handle formation last? According to TradingShot, the duration “largely depends .. on which of the following MA [moving average] periods will hold.”
Key support levels to watch are:
- 200-day Moving Average (1D MA200): This has historically acted as a strong support, triggering significant rebounds in the past.
- 50-week Moving Average (1W MA50): A reliable support level since March 2023, indicating a longer-term trend line.
The ‘cup’ portion of this pattern took shape between early 2022 and mid-2023, while the ‘handle’ has been developing within a downward channel throughout 2024. The next phase to anticipate is the potential upside once the handle formation concludes.
$100,000 – $110,000 Target: Is it Realistic?
Let’s talk numbers! Since the bear market bottom in November 2022, Bitcoin has seen three notable upward price surges, ranging from 91% to 99%. Building on this momentum, the analysis suggests that the next upward leg could propel Bitcoin into a target zone of $100,000 – $110,000. This projection hinges on the 1D MA200 holding firm as a support level. If this support holds, the cup and handle pattern suggests a powerful bullish breakout.
Investor Sentiment: Fearful Now, Bullish Later?
Interestingly, recent data reveals that the current Bitcoin price dip has triggered a wave of fear and disinterest among investors. On-chain analytics firm Santiment highlighted this in a post on X (formerly Twitter), noting that “this extended level of FUD [Fear Uncertainty and Doubt] is rate, as traders continue to capitulate.”
This widespread fear can actually be a contrarian indicator. Santiment further points out that Bitcoin trader “fatigue”, combined with ongoing accumulation by larger holders (whales), “generally leads to bounces that reward the patient.” In other words, when everyone else is fearful and selling, it can be the opportune moment for smart money to accumulate before a potential price rebound.
Key Takeaways: Is Bitcoin Poised for a Major Leap?
To summarize, here are the key points to consider:
- Bullish Cup and Handle Pattern: A significant technical indicator suggesting a potential major price surge for Bitcoin.
- $100,000 – $110,000 Target: Analysis projects this price range as a potential target if the pattern plays out as expected.
- Crucial Support Levels: Keep a close watch on the 1D MA200 and 1W MA50 as key support levels that will determine the pattern’s validity.
- Contrarian Investor Sentiment: Current market fear and potential trader fatigue could be setting the stage for a bullish reversal.
- Whale Accumulation: Ongoing accumulation by large Bitcoin holders adds weight to the potential for a future price increase.
While the cryptocurrency market is known for its volatility and unpredictability, the cup and handle pattern, coupled with on-chain data, presents a compelling case for a potential significant upward movement in Bitcoin’s price. Could we really see Bitcoin at $100,000 soon? Only time will tell, but the indicators are certainly pointing towards a potentially exciting ride ahead for Bitcoin holders. Stay tuned and keep a close eye on those charts!
Disclaimer: The information provided is not trading advice, Bitcoinworld.co.in holds no liability for any investments made based on the information provided on this page. We strongly recommend independent research and/or consultation with a qualified professional before making any investment decisions.


