Feeling the crypto market jitters? If you’re tracking Avalanche (AVAX), you’ve likely noticed a recent price dip. Over the last 24 hours, AVAX has seen a downturn, and this trend extends into the past week. Let’s break down what’s happening with Avalanche’s price, volatility, and market activity to understand the current landscape.
Avalanche (AVAX) Price Performance: A Snapshot of Recent Declines
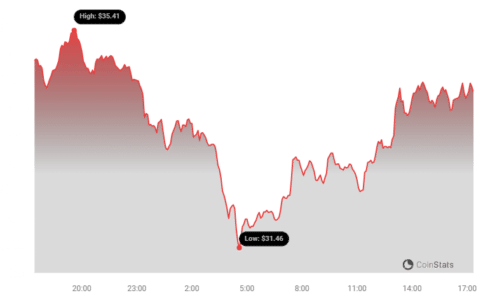
As of today, Avalanche (AVAX) is trading at $34.0. Looking back at the past 24 hours, the price has decreased by 3.88%. This isn’t an isolated 24-hour fluctuation; it’s part of a broader negative trend.

Zooming out to a weekly view, the picture becomes clearer. Avalanche (AVAX) has experienced a significant 15.0% loss over the past seven days. The price has moved from approximately $40.2 to the current $34.0. This consistent downward pressure raises questions about the factors influencing AVAX’s market behavior.
Volatility Check: How Bumpy is the AVAX Ride?
To understand the price movement better, let’s consider volatility. Volatility essentially measures how much the price of an asset swings up and down. Higher volatility means more significant price fluctuations, which can present both opportunities and risks for traders.
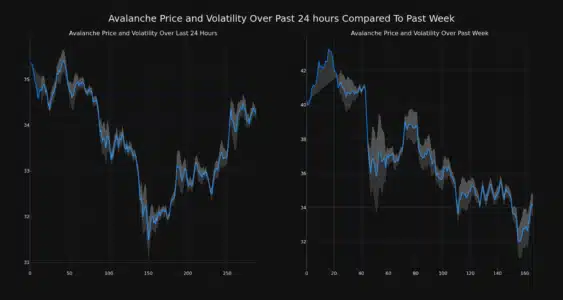
The chart below provides a visual comparison of Avalanche’s (AVAX) price movement and volatility over two different timeframes:
- Left Chart: Focuses on the past 24 hours.
- Right Chart: Expands the view to the past week.

Understanding Bollinger Bands: Your Volatility Guide
In these charts, you’ll notice gray bands surrounding the price lines. These are Bollinger Bands, a popular tool in technical analysis used to gauge volatility. Think of Bollinger Bands as dynamic price envelopes. They widen when volatility increases and contract when it decreases.
- Wider Bands = Higher Volatility: A larger gray area indicates greater price swings and uncertainty in the market.
- Narrower Bands = Lower Volatility: A smaller gray area suggests price stability and less dramatic fluctuations.
By observing the Bollinger Bands, you can quickly assess the level of volatility in AVAX, both in the short term (24 hours) and over the week.
See Also: Price Analysis: The Price Of Injective (INJ) Up More Than 10% In 24 Hours
Trading Volume & Circulating Supply: What’s the Connection?
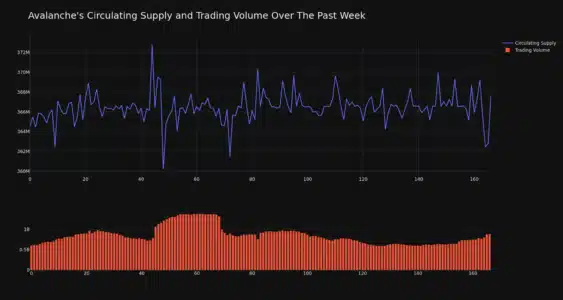
Now, let’s shift our focus to trading volume and circulating supply – two key indicators of market activity and tokenomics.
- Trading Volume Surge: Interestingly, the trading volume of Avalanche (AVAX) has increased by 46.0% over the past week. This significant jump suggests heightened interest and activity around AVAX, even amidst the price decline.
- Circulating Supply Increase: In tandem with the rising trading volume, the circulating supply of AVAX has also seen a slight increase of 0.85%.
This directional movement – both trading volume and circulating supply increasing – is noteworthy. It could indicate several things, such as increased market participation or strategic token releases.

Current Circulating Supply and Market Cap Ranking
The current circulating supply of AVAX now stands at 366.60 million coins. This represents approximately 50.92% of its total max supply of 720.00 million AVAX. A significant portion of the total supply is already in circulation, influencing market dynamics.
In terms of market capitalization, AVAX holds a strong position. Currently, Avalanche is ranked at #10 in the cryptocurrency market cap rankings, with a market cap of $12.56 billion. This top 10 ranking underscores AVAX’s significance in the crypto space, despite the recent price pullback.
Key Takeaways and Considerations for AVAX Investors
Let’s summarize the key points to consider if you’re following Avalanche (AVAX):
- Price Decline: AVAX has experienced a notable price decrease over the past 24 hours and the last week.
- Increased Volatility: Bollinger Bands indicate ongoing volatility in AVAX’s price movements.
- Surging Trading Volume: Despite the price dip, trading volume has significantly increased, suggesting continued market interest.
- Circulating Supply Growth: A slight increase in circulating supply is observed alongside rising trading volume.
- Strong Market Cap Ranking: AVAX remains a top 10 cryptocurrency by market capitalization.
Is it a Buying Opportunity?
The question on many investors’ minds is whether this price dip represents a buying opportunity. While this analysis provides a snapshot of recent market behavior, it’s crucial to conduct thorough independent research before making any investment decisions. Consider factors beyond price charts, such as Avalanche’s technology, ecosystem development, adoption rates, and overall market sentiment.
Stay Informed and Do Your Own Research
The cryptocurrency market is known for its volatility and rapid changes. Staying informed about market trends, project developments, and broader economic factors is essential for navigating this dynamic space successfully.
Disclaimer: The information provided is not trading advice. Bitcoinworld.co.in holds no liability for any investments made based on the information provided on this page. We strongly recommend independent research and/or consultation with a qualified professional before making any investment decisions.
Disclaimer: The information provided is not trading advice, Bitcoinworld.co.in holds no liability for any investments made based on the information provided on this page. We strongly recommend independent research and/or consultation with a qualified professional before making any investment decisions.


