Navigating the volatile world of cryptocurrency can feel like riding a rollercoaster. Just when you think you’ve caught an upward trend, the market can take an unexpected dip. Today, we’re diving into the recent price movement of Toncoin (TON), a cryptocurrency that’s been making waves. Is this dip a cause for concern, or just a typical market fluctuation? Let’s break down the latest data and see what’s happening with TON.
Toncoin Price Plunge: A 24-Hour Snapshot
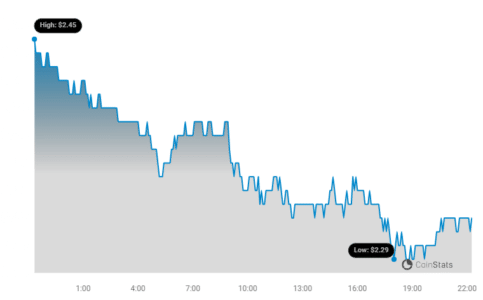
In the last 24 hours, Toncoin (TON) has experienced a downturn, with its price decreasing by 5.17%. This brings the current price of TON to $2.3. While a daily drop might raise eyebrows, it’s crucial to look at the bigger picture. Here’s a quick overview:
- Current Price: $2.3
- 24-Hour Price Change: -5.17%

As you can see from the chart above, provided by Coinstats, the recent price action shows a clear downward trend within the last day. But is this a complete reversal, or just a temporary pullback?
Weekly Uptrend vs. Daily Dip: What’s the Real Story?
To get a clearer perspective, let’s zoom out and examine Toncoin’s performance over the past week. Interestingly, despite today’s dip, TON has actually been on an upward trajectory over the last seven days. In fact, Toncoin has seen a positive trend of 4.0% this week, increasing from $2.21 to its current price. This paints a different picture than just focusing on the last 24 hours.
- Weekly Price Trend: Upward
- 7-Day Price Increase: 4.0%
- Price Movement (Past Week): From $2.21 to $2.3
This contrast between the daily decrease and the weekly increase highlights the inherent volatility of the cryptocurrency market. Short-term dips are common and often don’t negate a positive longer-term trend.
Volatility Check: Understanding TON’s Price Swings
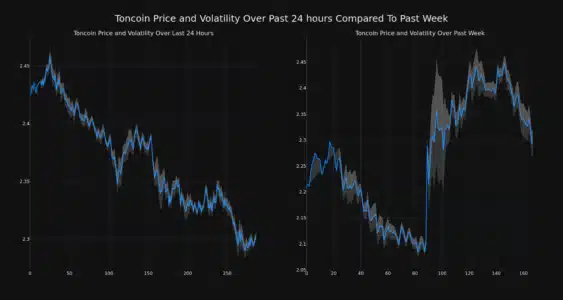
Volatility is a key characteristic of cryptocurrencies, and understanding it is crucial for investors. To visualize Toncoin’s volatility, let’s look at the following chart which compares the price movement and volatility over both the past 24 hours and the past week:

The gray bands in the chart are Bollinger Bands. These bands are a popular technical analysis tool used to measure volatility. Essentially, they show how much the price of an asset typically fluctuates around its average price.
Key takeaway about Bollinger Bands:
- Wider Bands = Higher Volatility: When the gray bands are wider, it indicates greater price fluctuations and therefore higher volatility.
- Narrower Bands = Lower Volatility: Conversely, narrower bands suggest less price movement and lower volatility.
Analyzing the chart, you can visually compare the daily and weekly volatility of Toncoin. This helps in understanding the risk and potential price swings associated with trading TON.
See Also: Price Analysis: Ethereum Classic (ETC) Down More Than 3% Within 24 Hours
Trading Volume and Circulating Supply: Are They Contributing to the Dip?
Beyond price and volatility, other factors can influence a cryptocurrency’s market behavior. Let’s examine Toncoin’s trading volume and circulating supply to see if they offer any clues about the recent price dip.
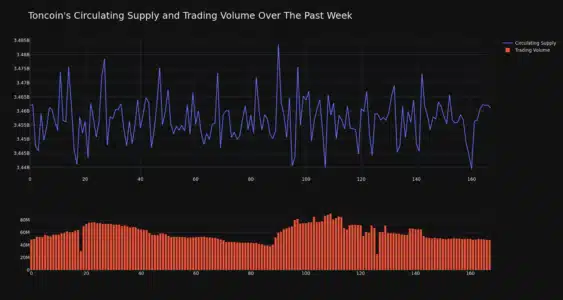
Interestingly, the trading volume for TON has decreased by 2.0% over the past week. This decrease in trading activity might suggest less buying and selling pressure in the market, which could contribute to price stagnation or even a slight downturn.
Simultaneously, the circulating supply of Toncoin has also slightly decreased by 0.03% over the last week. While a small percentage, a decrease in circulating supply can sometimes be seen as positive (potentially making the existing coins more scarce), but in this case, it seems to be moving in tandem with the decreased trading volume, possibly indicating overall reduced market activity.

Here’s a summary of the data:
| Metric | Change (Past Week) |
|---|---|
| Trading Volume | -2.0% |
| Circulating Supply | -0.03% |
Currently, the circulating supply of Toncoin stands at 3.46 billion. With this supply and current market dynamics, Toncoin holds the #15 rank in market capitalization, valued at $7.95 billion. This ranking reflects its significant position within the broader cryptocurrency ecosystem.
Key Takeaways and What to Watch For
So, what can we conclude from this analysis of Toncoin’s recent price movements?
- Daily Dip vs. Weekly Trend: While TON experienced a 5.17% price decrease in the last 24 hours, it’s important to remember the 4% uptrend over the past week. Short-term fluctuations are normal in crypto markets.
- Volatility is Present: The Bollinger Bands highlight the ongoing volatility of Toncoin, typical of cryptocurrencies. Traders should be prepared for price swings.
- Trading Volume and Supply: A slight decrease in both trading volume and circulating supply over the past week might be contributing to the current price action, suggesting a cooling off period in market activity.
- Market Cap and Ranking: Toncoin remains a significant cryptocurrency, holding the #15 market cap rank, indicating strong overall market confidence.
Final Thoughts: Is the TON Dip a Buying Opportunity?
The recent dip in Toncoin’s price could be interpreted in various ways. For short-term traders, it might be a signal to exercise caution. However, for long-term holders, or those looking to enter the TON market, this dip could potentially represent a buying opportunity, especially considering the positive weekly trend.
As always, the cryptocurrency market is dynamic and influenced by numerous factors. Staying informed, understanding market trends, and conducting thorough research are crucial for making informed investment decisions.
Disclaimer: The information provided is not trading advice. Bitcoinworld.co.in holds no liability for any investments made based on the information provided on this page. We strongly recommend independent research and/or consultation with a qualified professional before making any investment decisions.
Disclaimer: The information provided is not trading advice, Bitcoinworld.co.in holds no liability for any investments made based on the information provided on this page. We strongly recommend independent research and/or consultation with a qualified professional before making any investment decisions.


