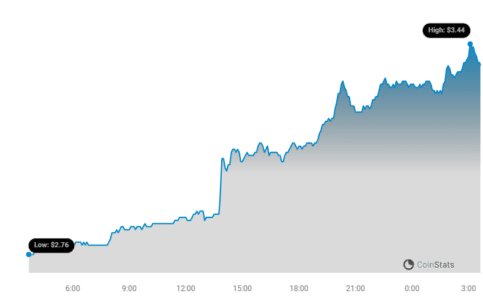
Cryptocurrency markets never sleep, and if you’re keeping a close eye on the charts, you might have noticed Toncoin (TON) making some significant moves! Over the past 24 hours, TON has experienced a notable surge, jumping by 15.45%. Let’s dive into the details of this price rally and understand what’s happening with Toncoin.
Toncoin’s Price Rockets: What’s Fueling the Surge?
As of today, Toncoin is trading at around $3.25. This marks a substantial 15.45% increase in just the last 24 hours, signaling strong bullish momentum for the token. But this isn’t just a short-term spike; looking at the bigger picture, TON has been on an upward trend for the past week as well.
In the last seven days, Toncoin has climbed over 19.0%, increasing from $2.72 to its current price point. This consistent growth suggests growing investor interest and positive market sentiment around TON. For those who have been following TON, it’s worth noting that its all-time high stands at $5.29. Could this recent surge be a step towards revisiting or even surpassing that peak?

See Also: Bitcoin Price Blasts Past $70K To Register New All-Time High
Decoding TON’s Price Action: A Look at Volatility
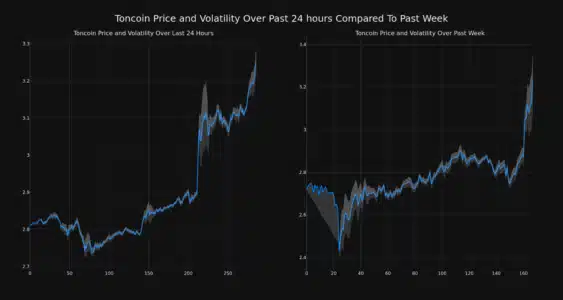
To better understand Toncoin’s recent performance, examining its price volatility is crucial. Volatility gives us an idea of how much and how quickly the price of an asset changes. Let’s analyze the provided charts to break down TON’s price movements and volatility over different timeframes.
The chart below compares Toncoin’s price movement and volatility in two key periods:
- Past 24 Hours (Left Chart): This shows the immediate price fluctuations and volatility within a single day.
- Past Week (Right Chart): This provides a broader perspective on the weekly price trend and overall volatility.

Understanding Bollinger Bands
In these charts, you’ll notice gray bands known as Bollinger Bands. These are a popular technical analysis tool used to measure volatility. Here’s a simple breakdown:
- Bollinger Bands Visualize Volatility: They essentially show the range within which the price of an asset typically trades.
- Wider Bands = Higher Volatility: When the bands are wider, or the gray area is larger, it indicates higher volatility in the price. This means the price is fluctuating more significantly.
- Narrower Bands = Lower Volatility: Conversely, narrower bands suggest lower volatility, meaning the price is relatively stable.
By observing the Bollinger Bands on the charts, you can quickly gauge the level of price fluctuation for Toncoin over the past day and week.
Trading Volume Surges as Circulating Supply Nudges Down
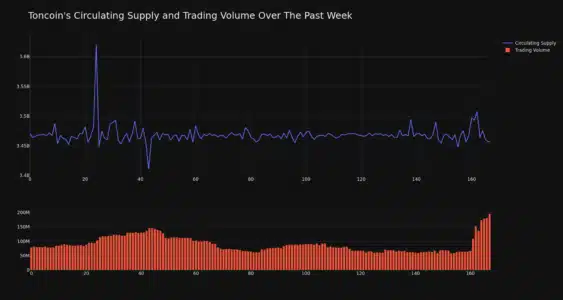
Another important factor to consider in price analysis is trading volume and circulating supply. Let’s examine TON’s data in these areas:
- Trading Volume Increase: Impressively, the trading volume for Toncoin has skyrocketed by 150.0% over the past week. This massive increase suggests heightened trading activity and potentially strong buying interest.
- Circulating Supply Decrease: Interestingly, while trading volume surged, the circulating supply of TON has slightly decreased by 0.39% in the same week.
This divergence between rising trading volume and slightly decreasing circulating supply can be a significant indicator. A reduced circulating supply, coupled with increased demand (reflected in high trading volume), can often contribute to upward price pressure.

Currently, the circulating supply of TON stands at 3.47 billion tokens.
Toncoin’s Market Position: Where Does it Stand?
According to the latest data, Toncoin holds the #18 rank in market capitalization. Its current market cap is estimated at a robust $11.21 billion. This ranking and market cap underscore TON’s position as a significant player in the cryptocurrency market.
In Conclusion: TON’s Bullish Momentum and Market Dynamics
Toncoin’s recent 15% price surge in 24 hours, coupled with a strong weekly performance, points towards a bullish trend. The analysis of volatility, surging trading volume, and a slight dip in circulating supply provides valuable insights into the current market dynamics surrounding TON. As always, the cryptocurrency market is dynamic and subject to change, so staying informed and conducting thorough research is essential.
Disclaimer: The information provided is not trading advice. Bitcoinworld.co.in holds no liability for any investments made based on the information provided on this page. We strongly recommend independent research and/or consultation with a qualified professional before making any investment decisions.
#Binance #WRITE2EARN
Disclaimer: The information provided is not trading advice, Bitcoinworld.co.in holds no liability for any investments made based on the information provided on this page. We strongly recommend independent research and/or consultation with a qualified professional before making any investment decisions.


