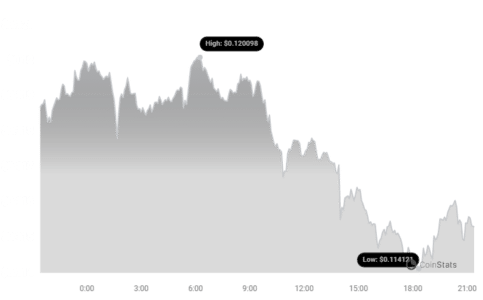
Stellar (XLM) has seen a recent dip in its price, leaving investors wondering about the future trajectory of this cryptocurrency. In the last 24 hours, the price of Stellar (XLM) has decreased by 3.2%, settling at $0.115. This price movement is part of a broader trend, as XLM has experienced an 11.0% loss over the past week, falling from $0.13 to its current level. Let’s dive into the details and understand what’s influencing Stellar’s price and what you should watch out for.
Stellar’s Price Performance: A Closer Look
To get a clearer picture of XLM’s recent performance, let’s examine the price chart and volatility.

As you can see from the chart above, Stellar’s price has been on a downward trend recently. This could be due to various market factors, including overall crypto market sentiment, profit-taking, or specific news related to the Stellar network.
Weekly Price Decline: Is it a Cause for Concern?
The past week has been particularly challenging for XLM holders. The 11% drop is significant and prompts the question: Is this a temporary dip or a sign of a more prolonged downturn? To understand this better, let’s consider price volatility.
Volatility Check: Daily vs. Weekly
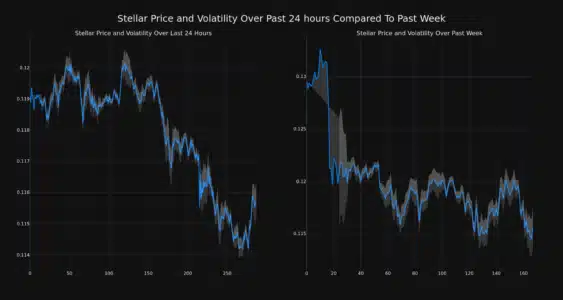
Volatility is a key indicator of how much and how quickly the price of an asset can fluctuate. Analyzing volatility helps us understand the risk associated with trading XLM. The chart below compares Stellar’s price movement and volatility over the past 24 hours versus the last week.

The gray bands in the chart are Bollinger Bands. These bands are a popular tool in technical analysis, used to measure volatility over a period. Wider bands indicate higher volatility, while narrower bands suggest lower volatility. Looking at the charts, we can observe:
- Daily Volatility (Left Chart): The Bollinger Bands for the 24-hour period show moderate volatility. This means that while there are price fluctuations, they are within a typical range for XLM.
- Weekly Volatility (Right Chart): The Bollinger Bands for the past week might show increased width, indicating higher volatility compared to the daily timeframe. This is expected given the 11% price drop, suggesting a more turbulent week for Stellar.
See Also: Starknet Community Approves STRK For Gas Token
High volatility can be concerning, but it also presents opportunities for traders. Experienced traders often look for periods of high volatility to capitalize on price swings, while long-term investors might see dips as buying opportunities, depending on their conviction in the asset’s future.
Trading Volume and Circulating Supply: What’s the Story?
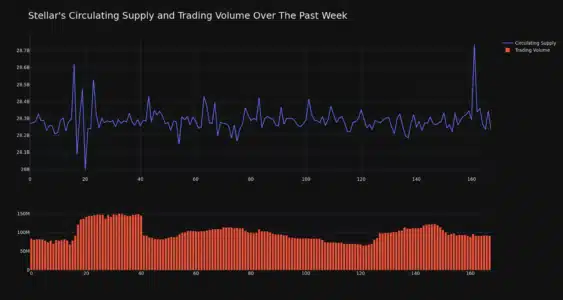
Beyond price and volatility, trading volume and circulating supply are crucial metrics to consider when analyzing a cryptocurrency’s health. Let’s examine Stellar’s data.

According to the data:
- Trading Volume Increase: Over the past week, Stellar’s trading volume has increased by 9.0%. A rise in trading volume during a price decrease can sometimes indicate increased selling pressure, but it can also suggest that traders are actively reacting to the price movement, trying to buy the dip or exit positions.
- Circulating Supply Decrease: Interestingly, the circulating supply of XLM has slightly decreased by 0.12% over the past week. A decrease in circulating supply, while price decreases, could suggest that some tokens are being moved off exchanges, potentially into staking or cold storage. However, the decrease is minimal and might not be statistically significant on its own.
Currently, the circulating supply of XLM stands at 28.27 billion tokens. This represents approximately 56.54% of its maximum supply of 50.00 billion XLM. The relationship between circulating supply, max supply, and tokenomics plays a role in the long-term valuation of a cryptocurrency.
Market Cap and Ranking: Where Does XLM Stand?
Market capitalization is a crucial metric that reflects the total value of a cryptocurrency. It’s calculated by multiplying the circulating supply by the current price. As per our data, Stellar (XLM) currently holds the #27 rank in market capitalization, with a market cap of $3.27 billion.
What Does Market Cap Ranking Tell Us?
- Market Position: Ranking at #27 indicates that Stellar is a well-established cryptocurrency with a significant market presence. It’s among the top crypto assets in terms of overall value.
- Investor Confidence: A substantial market cap generally suggests a level of investor confidence and adoption. However, market rankings can fluctuate, and it’s essential to consider other factors alongside market cap.
Key Takeaways and Actionable Insights
Let’s summarize the key points and derive some actionable insights from this analysis of Stellar’s recent price movement:
- Price Dip: XLM has experienced a price decrease of 3.2% in the last 24 hours and 11% over the past week.
- Increased Volatility: Weekly volatility is likely higher than daily volatility, as indicated by the price drop.
- Rising Trading Volume: Trading volume has increased by 9% over the week, suggesting active market participation.
- Slight Supply Decrease: Circulating supply has marginally decreased, which might be a point to monitor but is currently not a major factor.
- Solid Market Cap: XLM remains a top 30 cryptocurrency by market cap, indicating a strong market presence.
Actionable Insights:
- For Traders: The increased volatility might present short-term trading opportunities. Monitor price movements closely and use risk management strategies.
- For Investors: The price dip could be a potential buying opportunity for long-term investors who believe in Stellar’s fundamentals and future potential. Conduct thorough research before making any investment decisions.
- Stay Informed: Keep track of market news, Stellar network updates, and overall crypto market sentiment to make informed decisions.
In Conclusion: Navigating XLM’s Price Fluctuations
Stellar (XLM) is currently experiencing a price correction, reflecting broader market dynamics and potentially some token-specific factors. While the recent price drop and increased volatility might seem concerning, it’s crucial to look at the bigger picture. XLM remains a significant cryptocurrency with a robust market cap and active trading. Whether this dip represents a buying opportunity or a continued downtrend will depend on various market forces and developments in the Stellar ecosystem. As always, conducting your own research and considering your risk tolerance is paramount before making any investment decisions in the volatile cryptocurrency market.
Disclaimer: The information provided is not trading advice. Bitcoinworld.co.in holds no liability for any investments made based on the information provided on this page. We strongly recommend independent research and/or consultation with a qualified professional before making any investment decisions.
Disclaimer: The information provided is not trading advice, Bitcoinworld.co.in holds no liability for any investments made based on the information provided on this page. We strongly recommend independent research and/or consultation with a qualified professional before making any investment decisions.


