Is XRP on the verge of a significant price surge? Like Bitcoin, Ripple (XRP) has been showing positive momentum, consistently trading above the $0.70 mark against the US Dollar. But the big question on every crypto enthusiast’s mind is: Can XRP smash through the crucial $0.82 resistance level and continue its upward trajectory? Let’s dive into the latest price analysis to understand what’s driving XRP and what we might expect next.
XRP’s Recent Price Action: A Quick Recap
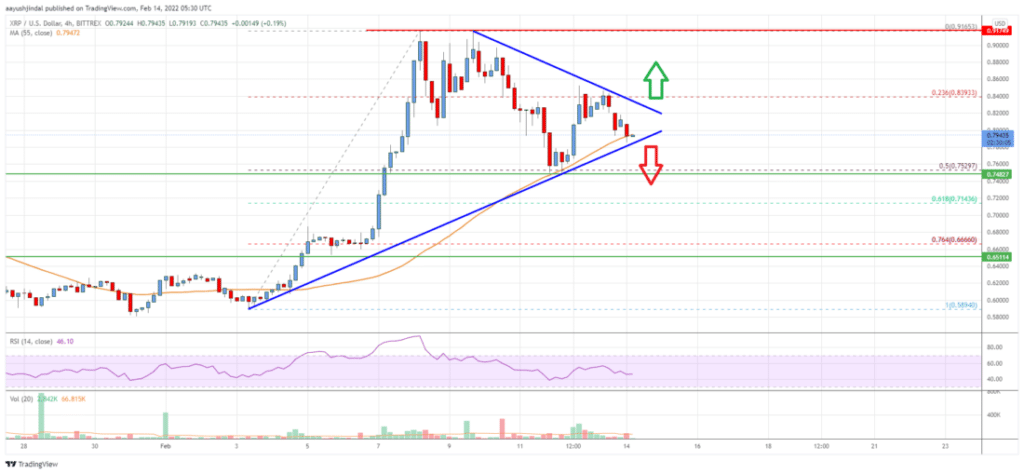
The past few days have been exciting for XRP! We’ve witnessed a noticeable acceleration in its price, breaking through several key barriers around the $0.70 mark against the US Dollar. The XRP/USD pair didn’t stop there; it confidently pushed past the $0.80 resistance, firmly establishing itself in the ‘green zone’.
The bullish momentum carried XRP even higher, briefly touching a peak near $0.9165. However, as with any market movement, a period of adjustment followed. We saw XRP retrace some of its gains, slipping below support levels at $0.8650 and $0.8500. This retracement even dipped slightly below the 23.6% Fibonacci retracement level, measured from the swing low of $0.5894 to the recent high of $0.9165.

Key Technical Indicators: What’s Shaping XRP’s Price?
Currently, XRP is navigating above the $0.75 level and is comfortably positioned above the 55-day Simple Moving Average (SMA) on the 4-hour chart. This is generally considered a positive sign, indicating potential underlying strength. However, there’s a significant contracting triangle forming on the 4-hour chart, with resistance firmly placed around $0.8200. Let’s break down what these indicators mean:
- 55-day Simple Moving Average (SMA): Trading above this SMA often suggests that the short-term trend is leaning towards bullish.
- Contracting Triangle: This chart pattern typically indicates a period of consolidation. A breakout from this triangle, especially to the upside, can signal the continuation of the previous trend. In XRP’s case, an upside breakout could mean a move towards higher prices.
- Fibonacci Retracement Levels: These levels are used to identify potential support and resistance areas. The retracement we saw below the 23.6% level and near the 50% level are crucial points to watch for potential bounces or further declines.
Resistance and Support Levels: The Battle Lines for XRP
Understanding key resistance and support levels is crucial for traders and investors. For XRP, these levels are currently defined as follows:
- Immediate Resistance: $0.8200. This is the critical level XRP needs to overcome to fuel further upward movement.
- Major Resistance: $0.8500. Beyond $0.82, this level presents the next significant hurdle. Successfully breaking through this could pave the way towards $0.9200 and potentially higher.
- Immediate Support: $0.7900. This level should act as initial support if XRP faces downward pressure.
- Key Support: $0.7520. A more substantial support level. A break below this could signal further declines.
- 50% Fibonacci Retracement Level: This level, calculated from the $0.5894 swing low to $0.9165 high, is also acting as a potential support zone.
In simpler terms: Think of resistance levels as ceilings that XRP needs to break through to go higher, and support levels as floors that prevent the price from falling further (at least temporarily).
What’s Next for XRP? Potential Scenarios
Based on the current analysis, here are a couple of potential scenarios to consider:
- Bullish Breakout: If XRP can successfully break above the $0.8200 resistance, especially the contracting triangle, we could see a continuation of the upward momentum. The next targets would be $0.8500, followed by a potential push towards $0.9200 and beyond.
- Bearish Retracement: If XRP fails to break through $0.8200, or if it faces strong rejection at this level, we might see a further downside correction. In this scenario, the support levels at $0.7900 and $0.7520 will be critical to hold. A sustained break below $0.7500 could lead to a deeper retracement, potentially towards $0.7000 in the near term.
Ripple vs. Bitcoin: A Quick Comparison
It’s interesting to note that the article mentions XRP trading in a positive zone like Bitcoin. While both are cryptocurrencies, they serve different purposes and have distinct characteristics:
| Feature | Bitcoin (BTC) | Ripple (XRP) |
|---|---|---|
| Primary Purpose | Digital Gold, Store of Value, Decentralized Currency | Payment Protocol for Financial Institutions, Facilitating Cross-border Payments |
| Consensus Mechanism | Proof-of-Work (Mining) | Federated Consensus |
| Supply | Limited (21 million) | Large (100 billion, with a significant portion held by Ripple Labs) |
| Volatility | Highly Volatile | Volatile, but potentially less so than some other altcoins |
| Focus | Decentralization, Store of Value | Speed and Efficiency of Transactions, Institutional Adoption |
While both Bitcoin and Ripple are part of the cryptocurrency ecosystem, their underlying technology, goals, and market dynamics differ significantly. Price movements in one don’t automatically guarantee similar movements in the other, although broader market sentiment can influence both.
Stay Informed and Trade Smart
The cryptocurrency market is known for its volatility, and XRP is no exception. Staying informed about price analysis, technical indicators, and market trends is crucial for making informed decisions. Keep an eye on the $0.82 resistance level – a break above it could signal an exciting next chapter for XRP. However, always remember to conduct your own research and consider your risk tolerance before making any investment decisions.
Related Posts – Ferrari joins the NFT universe through a collaboration with a Swiss…
Disclaimer: The information provided is not trading advice, Bitcoinworld.co.in holds no liability for any investments made based on the information provided on this page. We strongly recommend independent research and/or consultation with a qualified professional before making any investment decisions.


