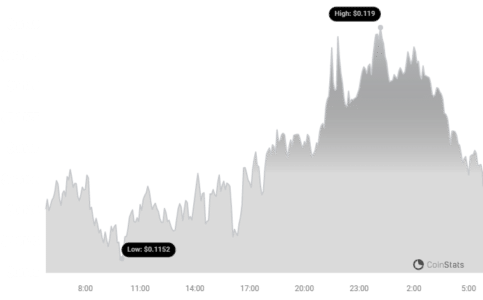
Stellar Lumen (XLM) is showing signs of life! After a period of consolidation, XLM is attempting to break free from the $0.1020 zone against the US Dollar. But can this momentum be sustained? Let’s dive into the technical analysis to uncover the potential for further gains and key levels to watch.
XLM’s Bullish Momentum: What’s Driving the Price?
XLM has been trading positively, hovering above $0.1100 against the US Dollar, mirroring Bitcoin’s movements. For XLM to truly take off, it needs to decisively clear the $0.120 resistance. Here’s a breakdown of the key factors influencing XLM’s price action:
- Breaking Key Resistance: XLM successfully broke above a crucial bearish trend line with resistance at $0.1140, signaling a potential shift in momentum.
- Above Key Moving Average: The price is currently trading above $0.1100 and the 55-period simple moving average (4-hour chart), indicating bullish sentiment.
- Fibonacci Retracement: XLM cleared the 50% Fib retracement level of the recent downward move, further supporting the bullish outlook.
Stellar Lumen Price Analysis (XLM to USD) – The Technical View
After establishing a base above the $0.100 zone, Stellar Lumen initiated a solid upward trajectory against the US Dollar. The XLM/USD pair surpassed the $0.1080 resistance, propelling it into positive territory.
The breakout above the bearish trend line, previously acting as resistance at $0.1100 on the 4-hour chart, fueled this upward movement.
The price’s successful clearance of the 50% Fibonacci retracement level (measuring the decline from $0.1367 to $0.0915) is a significant indicator. XLM’s current position above $0.1100 and the 55 simple moving average (4-hour) reinforces this positive outlook.
However, the upward climb faces immediate resistance around the $0.1195 zone, coinciding with the 61.8% Fibonacci retracement level of the same downward move. The next major hurdle lies near the psychological $0.1200 level.
See Also: Will Cardano (ADA) Rally To $0.6 Now? Key Insights For Ada Investors
A decisive break above $0.1200 could propel the price towards $0.1250, with further gains potentially leading to $0.1350 or even $0.1380.
On the flip side, immediate support rests near $0.110, with a more substantial support zone around $0.1050.

Failure to hold these support levels could trigger a decline towards $0.1020 in the short term, potentially revisiting the $0.100 level.
In summary, XLM is currently trading above $0.110 and the 55 simple moving average (4-hour). A sustained move above the $0.120 resistance is crucial for a significant upward surge.
Technical Indicators – What Are They Saying?
- 4 hours MACD: The MACD for XLM/USD is gaining momentum in the bullish zone, suggesting increasing buying pressure.
- 4 hours RSI: The RSI for XLM/USD is now above the 50 level, indicating strengthening momentum.
- Key Support Levels: $0.1100 and $0.1050 – These levels are critical for maintaining the current uptrend.
- Key Resistance Levels: $0.1195, $0.1200, and $0.1250 – Breaking these resistances could trigger further gains.
Disclaimer: The information provided is not trading advice. Bitcoinworld.co.in holds no liability for any investments made based on the information provided on this page. We strongly recommend independent research and/or consultation with a qualified professional before making any investment decisions.
#Binance #WRITE2EARN
Disclaimer: The information provided is not trading advice, Bitcoinworld.co.in holds no liability for any investments made based on the information provided on this page. We strongly recommend independent research and/or consultation with a qualified professional before making any investment decisions.


