Cryptocurrency markets are known for their exhilarating volatility, and Optimism (OP) is no exception. After a week of impressive gains, OP, the token powering the layer-2 scaling solution for Ethereum, is currently experiencing a minor pullback. Is this a temporary breather before another surge, or a sign of shifting tides? Let’s dive into the latest price movements and market indicators for Optimism to understand what’s happening.
Optimism (OP) Price Snapshot: What’s the Current Situation?
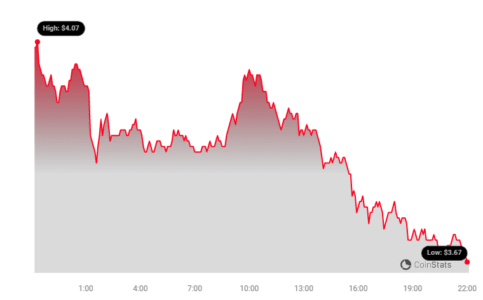
As of today, Optimism (OP) is trading at $3.71, marking a 3.11% decrease in price over the last 24 hours. While this might seem concerning at first glance, it’s crucial to view this daily dip within the context of its recent performance.

Looking at the bigger picture, over the past week, Optimism has demonstrated significant upward momentum. The price has increased by a robust 17.0%, climbing from $3.15 to its current level. This weekly surge highlights the underlying positive sentiment and growth potential surrounding Optimism, despite the current daily correction.
Decoding Optimism’s Price Fluctuations: Daily vs. Weekly Volatility
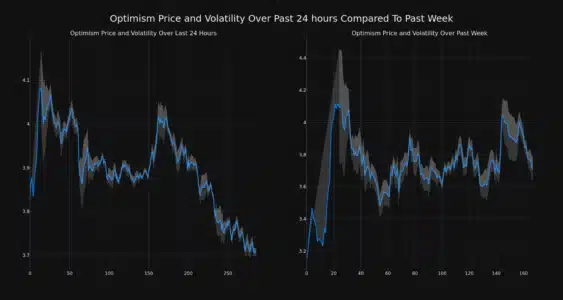
To better understand these price movements, let’s examine the volatility of Optimism over different timeframes. The following chart compares the price volatility over the last 24 hours versus the past week.

The charts utilize Bollinger Bands (the gray bands) as a visual tool to measure volatility. Here’s a simple breakdown of what Bollinger Bands tell us:
- Wider Bands = Higher Volatility: When the bands widen, it indicates increased price fluctuations and greater market uncertainty.
- Narrower Bands = Lower Volatility: Conversely, narrower bands suggest price stability and reduced volatility.
Analyzing the charts, we can observe the volatility in both the daily and weekly price movements of Optimism. By comparing the width of the Bollinger Bands, you can visually assess periods of higher and lower price swings.
Trading Volume and Circulating Supply: What’s the Connection?
Beyond price and volatility, trading volume and circulating supply are crucial indicators for assessing the health and momentum of a cryptocurrency. Let’s look at Optimism in these terms.
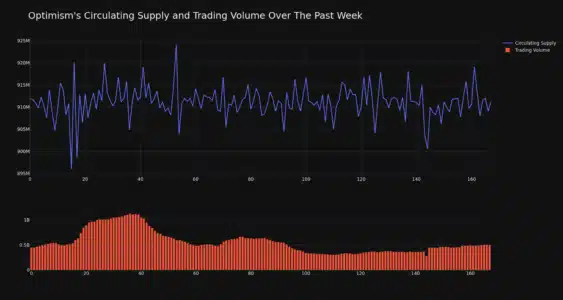
Interestingly, the trading volume for OP has increased by 11.0% over the past week. This surge in trading activity often suggests growing interest and participation in the market for Optimism. Higher trading volume can be a sign of increased liquidity and potentially stronger price movements in the future.

On the other hand, the circulating supply of OP has slightly decreased by 0.09% over the same week. This seemingly contradictory movement—increased trading volume with decreased circulating supply—could indicate various market dynamics at play. It might suggest that:
- Tokens are being moved off exchanges: Users might be withdrawing OP from exchanges for staking, holding in private wallets, or participating in DeFi activities within the Optimism ecosystem.
- Increased scarcity: A slight decrease in circulating supply, coupled with higher demand (indicated by increased trading volume), could potentially exert upward pressure on the price in the longer term.
Currently, the circulating supply of Optimism is 911.29 million OP. This represents approximately 21.22% of its maximum supply of 4.29 billion OP. Understanding the tokenomics and supply distribution is vital for long-term investment considerations.
Optimism’s Market Cap and Ranking: Where Does OP Stand?
Market capitalization is a key metric to gauge the overall size and dominance of a cryptocurrency. As per the latest data, Optimism currently holds the #29 rank in market cap, with a market capitalization of $3.38 billion.
Breaking into the top 30 cryptocurrencies by market cap is a significant achievement, reflecting growing investor confidence and adoption of the Optimism network. This ranking underscores Optimism’s position as a noteworthy player in the layer-2 scaling solutions landscape.
What Does This Mean for Optimism’s Future?
While the short-term price dip might cause some to pause, the overall picture for Optimism appears optimistic (pun intended!). The strong weekly gains, coupled with increased trading volume and a substantial market cap ranking, suggest underlying strength.
Optimism’s role as a layer-2 scaling solution for Ethereum is increasingly important as Ethereum continues to be the dominant platform for decentralized applications (dApps). By offering faster and cheaper transactions, Optimism addresses critical scalability challenges and contributes to the broader adoption of Web3 technologies.
See Also: Monero (XMR) Price Dropped 6% In 24 Hours As OKX Delists 20 Trading Pairs
Key Takeaways on Optimism (OP) Price Action:
- Short-term Dip, Long-Term Potential: Don’t be overly concerned by the 24-hour price decrease. Focus on the robust weekly growth and overall market indicators.
- Volatility is Normal: Cryptocurrency markets are volatile. Use tools like Bollinger Bands to understand and manage risk.
- Trading Volume is a Positive Sign: Increased trading volume suggests growing interest and liquidity for OP.
- Circulating Supply Dynamics: Monitor the circulating supply and its impact on price, especially in relation to demand.
- Strong Market Position: Optimism’s top 30 market cap ranking reflects its growing prominence in the crypto space.
Final Thoughts: Staying Optimistic About Optimism?
Optimism (OP) presents a compelling case within the cryptocurrency market. While short-term price fluctuations are inevitable, the underlying fundamentals, strong weekly performance, and increasing market adoption of layer-2 solutions paint a positive picture. As always, conducting thorough research and understanding your risk tolerance is paramount before making any investment decisions in the dynamic world of crypto.
Disclaimer: The information provided is not trading advice. Bitcoinworld.co.in holds no liability for any investments made based on the information provided on this page. We strongly recommend independent research and/or consultation with a qualified professional before making any investment decisions.
Disclaimer: The information provided is not trading advice, Bitcoinworld.co.in holds no liability for any investments made based on the information provided on this page. We strongly recommend independent research and/or consultation with a qualified professional before making any investment decisions.


