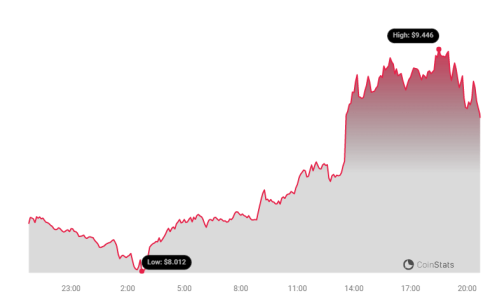
Cryptocurrency markets are known for their rollercoaster rides, and Render (RNDR) is no exception! In a surprising turn of events, the price of Render (RNDR) has experienced a significant jump, increasing by a solid 10.0% within the last 24 hours. This surge has pushed its price to $9.09, sparking conversations and renewed interest among investors and crypto enthusiasts. But is this short-term spike a sign of a larger trend reversal, or just a temporary breather in a volatile market? Let’s dive into the details.
RNDR’s Recent Price Action: A Tale of Two Timeframes
To truly understand the current price movement of Render, we need to look at both the short-term and long-term perspectives. While the past 24 hours have been undeniably positive, it’s crucial to remember the bigger picture. Just a week ago, RNDR was trading at $10.51. The subsequent negative trend led to a 10.0% decrease, bringing the price down. This recent 24-hour surge, therefore, appears as a counter-movement against the previous week’s downward trajectory. Currently, RNDR is still below its all-time high of $13.53, leaving room for potential growth, but also highlighting the inherent volatility of the crypto market.
Decoding the Charts: Volatility and Price Swings
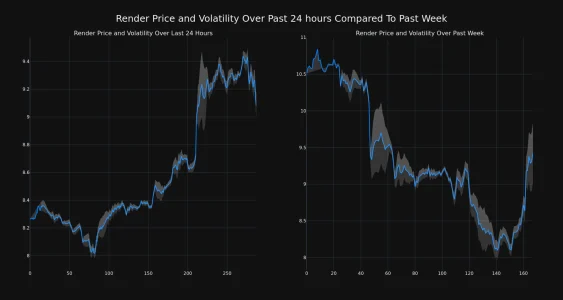
Visualizing price movements is often more insightful than just looking at numbers. The chart below provides a comparative view of Render’s price volatility over two key periods:
- Past 24 Hours (Left Chart): Shows the recent upward price movement and associated volatility within a single day.
- Past Week (Right Chart): Illustrates the broader trend and volatility over the last seven days, providing context for the recent surge.

Notice the gray bands in the charts? These are Bollinger Bands, a popular technical analysis tool used to measure market volatility. Essentially, Bollinger Bands indicate the range within which the price of an asset typically fluctuates.
Key takeaways from Bollinger Bands:
- Wider Bands = Higher Volatility: When the gray bands widen, it signifies increased price fluctuations and greater uncertainty in the market.
- Narrower Bands = Lower Volatility: Conversely, narrower bands suggest a period of relative price stability.
By examining the Bollinger Bands on the charts, you can quickly gauge the volatility associated with RNDR’s price movements in both the short and medium term.
Trading Volume and Circulating Supply: What’s the Story?
Price movements are just one piece of the puzzle. To get a more complete picture, let’s look at trading volume and circulating supply. Interestingly, the trading volume for RNDR has jumped by a significant 51.0% over the past week. This surge in trading activity suggests heightened interest and participation in the RNDR market.
However, in a somewhat contrasting move, the circulating supply of RNDR has slightly decreased by 0.35% during the same period. This means fewer RNDR tokens are available in the open market. Let’s break down what this could imply:
| Metric | Change (Past Week) | Potential Implication |
|---|---|---|
| Trading Volume | Increased by 51.0% | Increased market interest and activity; could indicate growing demand. |
| Circulating Supply | Decreased by 0.35% | Scarcity might be increasing, potentially putting upward pressure on price if demand remains high or increases. |
Currently, the circulating supply of RNDR stands at 388.65 million tokens. This represents a substantial 73.04% of its total max supply of 532.07 million. The limited max supply is a feature common in many cryptocurrencies, often designed to create scarcity and potentially drive long-term value.

RNDR’s Market Position: A Top Contender?
Where does RNDR stand in the vast cryptocurrency landscape? According to the latest data, RNDR currently holds the #34 rank in market capitalization. With a market cap of $3.55 billion, RNDR is a significant player in the crypto space, demonstrating substantial investor interest and market value. Its position among the top cryptocurrencies highlights its relevance and potential within the evolving digital asset ecosystem.
Is This a Buying Opportunity? Important Disclaimer
The recent 24-hour price surge in Render (RNDR) is certainly noteworthy. However, before making any investment decisions, it’s critical to exercise caution and conduct thorough research. The cryptocurrency market is inherently volatile, and past performance is not indicative of future results.
Disclaimer: The information provided in this article is for informational purposes only and should not be considered as financial or trading advice. Bitcoinworld.co.in does not assume any liability for investment decisions made based on this information. We strongly advise readers to conduct independent research and/or seek advice from a qualified financial professional before investing in any cryptocurrency.
In Conclusion: Riding the RNDR Wave
Render (RNDR) has shown a dynamic price movement recently, with a notable 10% increase in the last 24 hours, contrasting with a previous weekly dip. The increased trading volume and slight decrease in circulating supply add further layers to the story. Whether this recent surge marks the beginning of a sustained upward trend or is just a temporary fluctuation remains to be seen. As with all cryptocurrencies, vigilance, informed analysis, and a clear understanding of market risks are essential for navigating the exciting, yet unpredictable, world of digital assets. Keep a close eye on RNDR and the broader market trends to make well-informed decisions in your crypto journey!
Disclaimer: The information provided is not trading advice, Bitcoinworld.co.in holds no liability for any investments made based on the information provided on this page. We strongly recommend independent research and/or consultation with a qualified professional before making any investment decisions.


