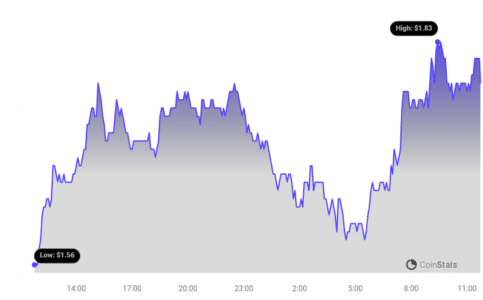
Buckle up, crypto enthusiasts! While the altcoin market has been experiencing a rollercoaster, one cryptocurrency is painting the charts green and defying the downward trend – Stacks (STX). Against the backdrop of recent market corrections, STX is showcasing remarkable strength, breaking through crucial resistance levels and marking its eighth consecutive week of bullish momentum. Let’s dive into what’s fueling this impressive surge and explore what’s next for STX.
Stacks (STX) Breaks Resistance: What’s Driving the Bull Run?
Since late November 2023, Stacks has been on an undeniable upward trajectory. This isn’t a gradual climb; it’s been a swift and decisive rally with minimal pullbacks. Even the recent market-wide flash crash couldn’t derail STX’s bullish momentum. In fact, that dip proved to be a springboard for even greater gains.
Last week’s flash crash, which impacted the broader crypto landscape, saw STX momentarily falter. However, this dip was short-lived and incredibly telling. The price action formed a significant long lower wick on the weekly chart – a classic sign of strong buying pressure. This wick essentially confirmed that the previous resistance level had flipped into robust support. Following this validation, STX not only bounced back but powerfully resumed its upward climb, culminating in a bullish weekly close and further gains this week.
As of now, STX has impressively reached a peak of $1.83, marking its highest price point since March 2023. This is no small feat, especially considering the contrasting performance of many other altcoins recently.

Decoding the Momentum: What is the RSI Telling Us?
To understand the strength and sustainability of this STX rally, let’s turn to the Relative Strength Index (RSI). The RSI is a vital tool for traders, acting as a momentum gauge to identify overbought or oversold conditions in the market. It helps determine if it’s time to buy (accumulate) or sell an asset.
Here’s how to interpret the RSI:
- RSI above 50 & Trending Upwards: This is bullish territory! It indicates that buyers (bulls) are in control of the market momentum.
- RSI below 50: Conversely, readings below 50 suggest that sellers (bears) have the upper hand.
Currently, the weekly RSI for STX is not only above 50 but also trending upwards. These are strong indicators of a continuing bullish trend. While the RSI has ventured into overbought territory (typically above 70), crucially, there’s no bearish divergence present. Bearish divergence occurs when the price makes a new high, but the RSI fails to make a new high, often signaling a potential trend reversal. The absence of this divergence in STX’s case further reinforces the bullish outlook.
See Also: Binance Announced The Listing Of This Altcoin, Triggering Increase In Price
STX Price Prediction: Eyes on $2 – Or a Potential Pullback?
Looking at the weekly timeframe, the bullish picture for STX is clear. However, zooming into the daily timeframe reveals some potential headwinds that could influence the short-term trajectory. Are these just minor bumps on the road to $2, or signs of a larger correction?
Let’s examine the daily chart:
- Ascending Parallel Channel: For the past 20 days, STX’s price has been contained within an ascending parallel channel. These channels are often associated with corrective phases in the market. This means that a breakdown from this pattern is statistically more probable than a sustained breakout.
- Bearish RSI Divergence: Adding to the caution, the daily RSI has flashed a bearish divergence (indicated by the green line in the chart below, though not visible in the provided text). This divergence suggests weakening bullish momentum in the short term and could precede a price correction.
However, it’s crucial to remember that these signals aren’t definitive predictors of a breakdown. There are counter-arguments to consider:
- Channel Resistance Tests: Stacks has repeatedly tested the resistance trendline of the ascending channel. Each test weakens the resistance, increasing the likelihood of an eventual breakout.
- Bearish Divergence Trendline Break: The bearish divergence trendline on the RSI is also nearing a potential break. If broken, this would negate the bearish signal and potentially pave the way for further upside.
See Also: US SEC Warns Against FOMO On Bitcoin Spot ETFs
Bullish Scenario: Breakout to $2.40?
If STX manages to decisively break out of the ascending parallel channel, the upside potential is significant. A breakout could propel STX another 35% higher, targeting the next major resistance level around $2.40. This would be a substantial move and further solidify STX’s bullish dominance.
Bearish Scenario: Fall to $1.20 Support?
Conversely, if the ascending channel holds firm and STX breaks down, a correction is likely. A breakdown could lead to a 30% drop, bringing the price down to the nearest significant support level around $1.20. This level would be crucial to watch for potential buying interest to re-emerge.
Disclaimer: The information provided is not trading advice. Bitcoinworld.co.in holds no liability for any investments made based on the information provided on this page. We strongly recommend independent research and/or consultation with a qualified professional before making any investment decisions.
In Conclusion: STX at a Crossroads
Stacks (STX) presents a fascinating case study in the current crypto market. Its robust bullish momentum, particularly against the backdrop of altcoin market weakness, is noteworthy. While the weekly chart paints a clearly bullish picture, the daily timeframe introduces some short-term uncertainties with the ascending channel and bearish divergence.
Whether STX breaks upwards towards $2.40 or corrects down to $1.20 hinges on its ability to overcome the resistance channel and negate the bearish RSI divergence. Keep a close eye on STX’s price action and volume in the coming days to gauge the direction of its next significant move. As always, remember to conduct thorough research and manage your risk when navigating the volatile cryptocurrency markets.
Disclaimer: The information provided is not trading advice, Bitcoinworld.co.in holds no liability for any investments made based on the information provided on this page. We strongly recommend independent research and/or consultation with a qualified professional before making any investment decisions.


